Solving a problem means not just correcting its consequences but eliminating the causes. The root cause analysis method will help you understand why the actual result does not match the expected one and what needs to be changed in the first place. One of the most understandable and effective techniques recommended by experts is the Ishikawa diagram.
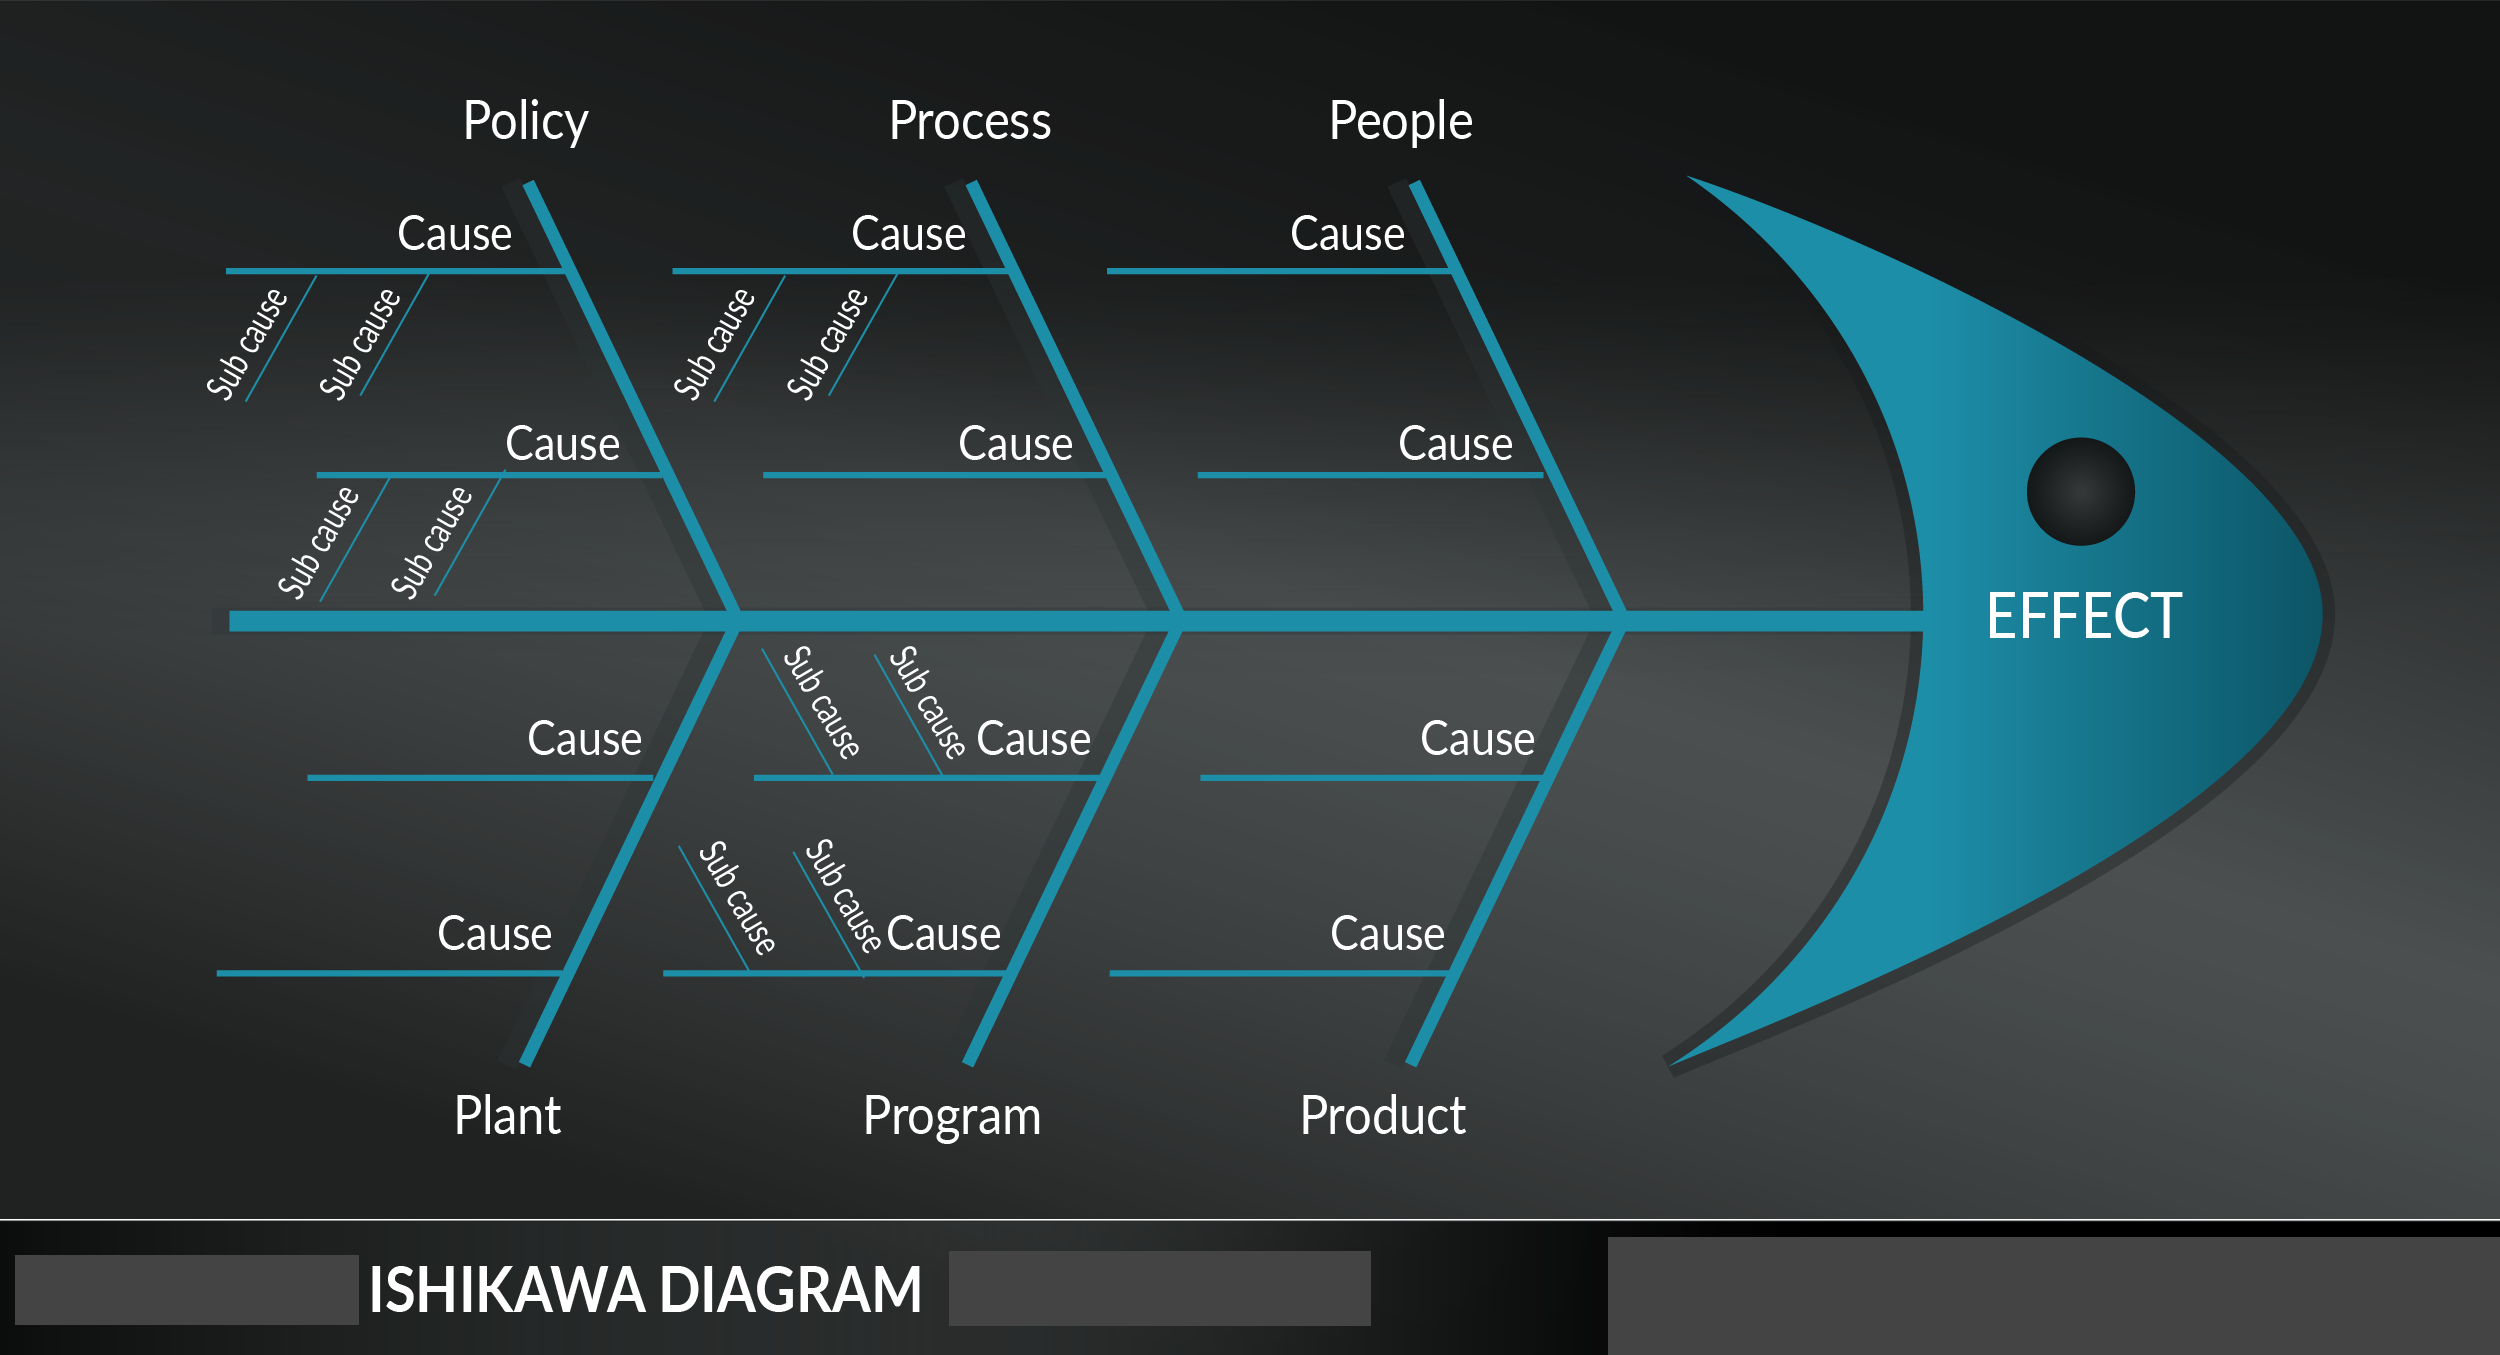
Because of the appearance of this graphical diagram, it is called the “fish skeleton” or “fishbone” (Fishbone diagram). This method was proposed in the early 1950s by a professor at the University of Tokyo, Kaoru Ishikawa, who dealt with quality management and developed systems for optimal production organization for the Toyota automobile company.
The Ishikawa diagram is used in product development and continuous improvement, providing a systematic approach to identifying the actual causes of nonconformities. The tool helps to focus primarily on the cause of the problem rather than the solution and structures ideas for further analysis.
In this article, we will look at the simple but very effective analysis method that helps to qualitatively determine the causal relationships between the problem and its provoking factors, as well as to quantify the risks associated with them. Read on to find out what an Ishikawa diagram is, why a business analyst needs it and why it is recommended.
How to Build an Ishikawa Diagram: A Practical Example
Let’s look at how the Ishikawa diagram works as a method of analysis using the example of a problem that almost every business faces: low sales. The primary causes of this situation may be the following factors:
- customer acquisition channels;
- business processes;
- products/services sold;
- employees;
- market features.
Further, these primary reasons should be detailed into secondary ones, tertiary ones, etc., specifying the factors to the required level of abstraction.
Since the diagram’s purpose is to find the most significant cause of the problem, then the diagram should display all possible factors, even those that seem insignificant. You can use the iceberg model to the behavior patterns and other factors in your analysis. After plotting all possible causes on the Ishikawa diagram, they are evaluated and ranked in order of importance to highlight the most important ones that most affect the problem and make the optimal management decision to eliminate it.
According to the Pareto principle, only a few are the most significant among the many probable causes that result in problems. To find them, you should conduct:
- Systemization and collection of all reasons that affect the issue under study directly or indirectly;
- Organizing the causes according to cause-and-effect blocks and semantic;
- Classifying them within each category;
- Evaluation of the emerging picture.
Thus, the Ishikawa diagram allows you to systematize all the potential causes of the problem being analyzed in a simple and understandable form, highlight the most significant of them and conduct a level-by-level search for the leading root cause. It is noteworthy that this method implements a qualitative and quantitative analysis of a problem situation.
Advantages, Disadvantages, and Connection With the Quantity Management System
In conclusion, we note the pros and cons of the considered method of finding root causes in practical business analysis. The advantages of the Ishikawa diagram are:
- ease of design and understanding;
- clarity of presentation of results;
- stimulation of creative thinking;
- the ability to show the relationship between the causes of the problem and compare their relative importance.
The downside of these advantages are the following disadvantages:
- lack of logical rules for checking how chains of causes lead to a problem;
- subjective interpretation of both qualitative and quantitative analysis;
- a complex and not structured diagram will not allow you to draw the correct conclusions.
Nevertheless, despite the noted shortcomings, the Ishikawa diagram is an excellent business analysis method, which is often used in practice when identifying needs and finding potential solutions. It is no coincidence that it is included in the 7 tools of the quality management system (QMS).